Overview
Navigation
Each section of this interactive resume tells a story about things I have accomplished in my work, including examples with which you can play. The first company I founded myself was Zat, Inc. There are also large companies, for example Google, where I worked on three projects: Vanadium, Travel, and Flutter and Dart. I have also worked in a Computer Research Lab, as well as in smaller companies, and in academic settings, both as a student and a teacher.
What follows is a more normal resume. Icons like this are links to further information in other sections.
Employment
Google Inc., Senior Software Engineer and Developer Advocate. June 2014 to May 2019
Dart and Flutter. Software engineer and Developer Advocate for Flutter and the Dart language. Built a community of enthusiastic developers, gave talks, wrote articles, organized events, and created software. Helped refine the strategic vision for new products, worked with customers, evangelized new ideas and influenced product decisions.
Travel Group. Front-end engineer building web apps, mobile apps, and interactive maps for Destination Explore, Google's new travel planning product. Created collaboration between Travel and Maps groups.
Vanadium Project. Infrastructure and tools for the next generation of distributed applications, focusing on advanced security and distributed naming. Applications include the Internet of Things and IndieWeb. Used advanced technologies including web components (Polymer), FRP (Mercury), and interactive visualization (D3).
FlightStats, Inc, Principal Engineer; and Zat LLC, President and Founder, September 2011 to May 2014
Part of team building developer portal. Then evangelized it through conference talks, courses, magazine articles, and example applications. Converted company over to open-source mapping software and data, saving them an estimated $3.6 million a year. Built customizable travel webapps for airlines and airports, using advanced web technologies including Leaflet, TileMill, Google Maps, TileStache, Amazon AWS, and Node.js. http://flightstats.com Spun off new company to sell these apps.
Contrary Capital, LLC, January 2002 to September 2011
My business that helped start companies. Examples: Co-founder and CTO of Simply Local TV, a startup enabling local (location-based) digital signage advertising; Co-founder and CTO of DigiSlice, Inc., a startup that sold component-based enterprise applications and tools.
Emota.net, CTO, December 2009 to July 2011
Advanced web applications supporting social networks for seniors to improve healthcare outcomes. Groundbreaking work on implicit communication, peripheral awareness, and minimal communication. Specified, designed, and programmed innovative interactive webapps using Javascript, jQuery, HTML5, CSS3, SVG, Node.js, Drupal, and animation. Also built mobile, multi-touch interfaces.
Banff Centre for the Arts, June 1996 to December 2007 and September 1990 to May 1991
Faculty, Staff, Consultant, Advisor. Helped define major programs on interactive web content and virtual reality at a prestegious Canadian art institution. Worked with artists, wrote proposals, defined program directions. Collaborations with companies including Apple, RealWorld, Microsoft, Sun, Interval Research, Silicon Graphics, and dozens of others. Named a Banff Centre Fellow in 2007. http://www.banffcentre.ca/
The eMarket Group, December 2001 to February 2006
CEO and member of Board of Directors for multi-million dollar e-commerce company. Company handled all aspects of e-commerce and merchandising for large media clients, including HBO, Sony, Amazon, Paramount, Tribune Media, Douglas Adams, and many others. Raised money, reorganized company, brought in major new contracts. Company was recognized by Internet Retailer magazine as one of the Top 300 Retail Web Sites, and the Inc. 500 list of fastest growing private companies.
Zat, Inc, August 1996 to March 2001
Founder, President, and CTO of a company that developed and sold solutions for component-based distributed-application assembly in Java. Formed company, built team, acquired funding, assembled technical advisory board containing industry luminaries (Andries van Dam, Adele Goldberg), designed and built web site, managed employees, performed marketing, sales, and evangelism duties. Product was awarded "Programming Tool of the Year" at the Web '99 conference. In June, 2000, Zat was acquired in a deal valued in the mid-8-figure range, which I negotiated.
Ithaca Software / Autodesk, May 1991 to May 1996
Recruited by founder Carl Bass to define and build future products for successful startup company. Technical lead and chief designer on project to define and build tools for developing distributed graphics applications based on components. Collaborated with industry luminaries. Wrote successful book on company's flagship product. Company was acquired by Autodesk. Carl is now CEO of Autodesk.
The Instruction Set and Instantiations, 1989 to 1991
Wrote and presented courses internationally on object-oriented design, C++, and object-oriented databases.
Cogent Research, 1988 to 1990
Built and managed graphics group for startup company. Company created a line of distributed graphics computers, including hardware and software. Designed the underlying parallel technology for, and was part of the team that developed a distributed version of the UNIX operating system, including a distributed window system and user interface.
Oregon Graduate Institute (now OHSU), 1985 to 1988
Taught graduate-level courses on computer graphics and parallel programming.
Tektronix Computer Research Lab, 1983 to 1988.
Member of Technical Staff. Research and development work on constraint languages and user interfaces. Products included first interactive graphical interface for symbolic algebra systems, MECAD and EECAD systems based on constraints.
Texas Instruments, 1977 to 1980
Led graphics group in Geophysical Services Division. Assembled and managed the team that developed the world's first interactive 3D graphics workstation for seismic interpretation (both hardware and software). This pioneering product set the standard that is now the dominant technology used for oil exploration, a multi-billion dollar market.
Academic
Ph.D. in Computer Science from the University of North Carolina at Chapel Hill. Emphasis on computer languages, distributed programming, and computer graphics. 4.0 GPA. Research and teaching assistant for Fred "Mythical Man Month" Brooks, who was also on my dissertation committee. One of first users of C++ outside of Bell Labs (before it was released). Heavy involvement with SIGGRAPH conference. Dissertation on constraint languages.
Graduate-level courses at Massachusetts Institute of Technology and Oregon Graduate Institute on parallel computing and graphics.
B.A. in Electrical Engineering from Rice University, with emphasis on computer hardware and social modeling. Research on social modeling (based on "Limits to Growth").
B.A. in Fine Arts from Rice University, with emphasis on computer graphics, film making, and photography. Created first computer-generated hologram.
Professional Activities
Presented courses and workshops on building mapping applications at Open Street Map: State of the Map, NACIS (North American Cartographic Information Society), Webvisions, Open Source Bridge, and GIS in Action conferences. See slides at http://www.slideshare.net/wmleler/presentations.
Entrepreneur in Residence for the Open Technology Business Center, an incubator for technology start-ups. 2006 to 2011. http://www.otbc.org
Director of Open Tech Space, 2008 to 2010. A non-profit that created spaces to bring together creative types, technologists, and business types. Ran the electronics lab at TechShop, raised funding (including from Google), sponsored courses.
University of Victoria, Wellington, New Zealand. 2004 to 2005. Visiting Researcher.
University of Manchester. Manchester, England. 1988 to 1989. Honorary Research Fellow. Performed research on distributed software and hardware, supervised students.
Proposed and presented session at JavaOne conference on application assembly.
Member of GAF (Graphics Application Framework), a cross-industry working group assembled by Andries van Dam (Brown University) and Salim Abbi-Ezzi (Microsoft and Sun Microsystems) to design the next frameworks for object-oriented computer graphics.
Taught course at SIGGRAPH (international computer graphics conference) on distributed computer graphics.
Independently designed, implemented, and distributed Bertrand, the first constraint programming language.
Program committee for Eurographics conference on object-oriented graphics.
Course reviewer for SIGGRAPH for many years.
Resident of Leighton Artist Colony, Banff Centre for the Arts, summer 1986.
Major Publications
I am an avid writer. I have written two books, several chapters for other books, delivered talks at hundreds of conferences, presented dozens of courses at universities, conferences, and at companies, and published quite a few articles in journals and magazines (from Byte magazine to IEEE Computer Magazine and various ACM Journals). This is just a list of major publications.
What's Revolutionary about Flutter. 2017. My first article about Flutter held the #1 page rank for over a year, and is still widely referenced.
Why Flutter Uses Dart. 2018. Article explaining why Flutter was based on the Dart programming language.
The top seven alternatives to the Google Maps API. 2012. Article on switching from Google Maps to (mostly) free alternatives.
3D with HOOPS. Book published by Addison-Wesley in 1996, on how to write 3D computer graphics applications.
Chapter in book Object-oriented Programming for Graphics, published by Springer-Verlag in 1995.
Actor-Based Simulation + Linda = Virtual Environments. Second Eurographics Workshop on Object-Oriented Graphics, 1991. Using distributed simulation techniques to build virtual reality systems.
Linda Meets UNIX. Paper published in IEEE Computer Magazine in Feb. 1990 on a distributed version of the UNIX operating system and its user interface.
Constraint Programming Languages - their specification and generation. Book published by Addison-Wesley in 1988. This was the first book published on constraint languages, and introduced Bertrand, a novel system that used augmented term rewriting to generate domain-specific constraint solving systems. Constraint systems are now heavily used in such diverse markets as computer-aided design (CAD) and commodities trading.
An Interactive Graphical Interface for Symbolic Algebra Systems. With Neil Soiffer. AAECC 1985. First interactive graphical interface for computer algebra systems.
A Small, High-Speed Dataflow Processor. International Conference on Parallel Processing 1983. Design of a high-speed parallel processor.
Human Vision, Anti-Aliasing, and the Cheap 4000 Line Display. SIGGRAPH conference, 1980. Seminal paper on the human visual system and how to take advantage of it to simulate high resolution displays.
Numerous papers presented at conferences and workshops on distributed computing, virtual reality, mapping, computer languages, and object-oriented graphics. There is a partial listing at ResearchGate.
Inventions
Interactive system for component assembly, used for generating enterprise applications, interactive multimedia applications, and web applications. 2000
Part of team that created first desktop parallel supercomputer, including a distributed version of the UNIX operating system and a distributed window interface. 1990
System for generating book indices for Troff documents. 1986
First Turing-complete constraint language, described in first book on constraint languages. 1986
First interactive graphical interface for symbolic algebra systems. 1985
First interactive graphics workstation for 3D oil exploration. 1979
Designed and built hardware and software for first interactive system to allow television stations to display election results in near-real time. 1977
Ghostwriter VLSI chip for interactive toy. 1981
First computer generated hologram. 1977
Related Hobbies
Travel, photography, performing music, politics.
Flutter and Dart
I worked as a Developer Advocate for Flutter and Dart at Google.
Flutter is a new, open source SDK for building fast and beautiful native user interfaces. Flutter was initially released for building apps for both iOS and Android, from a single codebase. But it can now be used to build webapps and desktop apps on multiple platforms, including Mac, Windows, Linux, Raspberry Pi, TVs, and even the Google Assistant. Flutter is almost entirely written in Dart, a powerful but relatively new language. I was the first Developer Advocate for Flutter.
When I joined the Flutter team they had a very good product that was in early alpha. However, they had not figured out how to position it in a very crowded marketplace. Most developers would not take Flutter seriously because they viewed it as one more cross-platform solution, and cross-platform mobile had a very bad reputation.
My major task was to educate the world as to the benefits of Flutter and Dart both by writing articles and giving talks, by working with outside developers, and getting users of Flutter to write articles about their experiences. This work was very successful, and Flutter is now growing extremely quickly in popularity and use, worldwide.
I have given dozens of talks in nine countries on three continents, written extremely popular articles, built a community of enthusiastic developers, worked with customers and Google partners, created codelabs, developed and published software, and helped refine strategy. I successfully created several talking points about Flutter that have been adopted widely by the mobile industry and used by other speakers and authors to talk about Flutter. I also helped put on a very successful conference, DartConf, including running the Unconference and the Lighting Talks, and helping write the DartConf mobile app (in Flutter, of course).
Here is what the Flutter marketing manager said about my work:
Wm has been a key driver in Flutter's message and recent success. Having started at a time where Flutter's fit in the market was questionable, Wm has transformed perceptions of Flutter globally with his confident and detailed analysis and presentation of Flutter's value proposition and reason for existence. All his talks have high ROI, and his contribution extends beyond those as Wm is a frequent contributor to online conversations.
Having co-presented with him multiple times, I can say with confidence that Wm is able to explain Flutter and its benefits better than anyone else I know. The best part; Wm is so passionate about this topic and framework.
And here are comments from Flutter's senior technical writer:
Wm is a natural writer. Because of the extensive work (talks, unconference sessions, and so on) he has done with external developers, he understands where the sticking points are for developers: their concerns and why they might be reluctant to try a yet another new Google technology. The articles he's written tend to go right to the heart of the issue. His writing is well organized, to the point, and definitely impactful and the rankings of these articles reflect their impact.
Wm's DartConf participation was integral to the success of the conference. He brought new ideas to the table (particularly the unconference sessions and the ribbon badge swag) and both were well received. He was engaged with the conference and the attendees. I also heard from the attendees that this was one of the best conferences they had ever attended.
Artifacts
My articles together currently receive over a thousand views a day.
- What's Revolutionary about Flutter (August 2017). This was the first article I published about Flutter. For a year, it had the highest page rank of any article about Flutter. It has hundreds of thousands of views and is widely referenced by other articles.
- Why Flutter Uses Dart (February 2018). This article had the highest page rank of any article about the Dart language for eight months. It singlehandedly stopped people from asking why we didn't write Flutter in Kotlin. It has hundreds of thousands of views and is widely referenced.
- Pitching Flutter to your company or client (November 2018) The business case for Flutter. Unusual in that it was written to help programmers who were trying to convince their upper management to switch to Flutter.
- What's Awesome about Flutter (video of a talk on Flutter)
- Firebase for Flutter codelab This codelab was the 4th most popular Google codelab during Google I/O 2018, and the most popular codelab on Flutter.
- Perspective on Flutter (June 2018) The Transform Widget video (January 2019). Article and video about using the Transform widget to add 3D to Flutter (see below).

Travel Group & Destination Explore
ViaHey
I love to travel, but building tools for travel is a challenging problem. I have been involved in a few companies that built tools for travelers. Even before I joined the travel group I kept thinking about travel. Google has so much data related to travel, and many tools (Maps, Search, Earth, Cardboard, Flights, Translate, etc.) that are used by travelers, but these tools are not well integrated. For example, at that time Google's travel tools did not include any interactive maps, and Google Maps did not link to Google's travel tools.
In my spare time, I wrote a document that proposed a project (called ViaHey) to leverage and integrate Google's travel-related products. I also set up meetings with people in various groups (including Maps, Cardboard, and Travel) to see if I could get them to work together to mutual benefit. In the end, when Vanadium went dormant I decided to join the Travel group.
Destination Explore
I worked as a Front End engineer for Destination Explore, an immersive app embedded in Search (GWS) to help people decide on where to go on a trip. We were "mobile first", building a mobile webapp and then a separate desktop version. These products have been released, and they have been a success.
For example:
- Here is a destination guide for Barcelona.
- Here is the "plan a trip" page that helps you find flights and hotels for your trip.
Maps
I worked on many parts of Destination Explore, but the thing I am personally most proud of is that I talked them into letting me embed two interactive maps in the desktop version of the app.
The first map displays all the top sights for a destination.
Here's a screenshot of the map for Barcelona:
 (or open it in a new window and interact with it).
This map has other features. If you click on a sight it shows a panel with more information.
You can also "star" a sight as a favorite, and it will show up as starred on all your Google maps.
And street view works, so you can get a street-level view of any point of interest.
(or open it in a new window and interact with it).
This map has other features. If you click on a sight it shows a panel with more information.
You can also "star" a sight as a favorite, and it will show up as starred on all your Google maps.
And street view works, so you can get a street-level view of any point of interest.
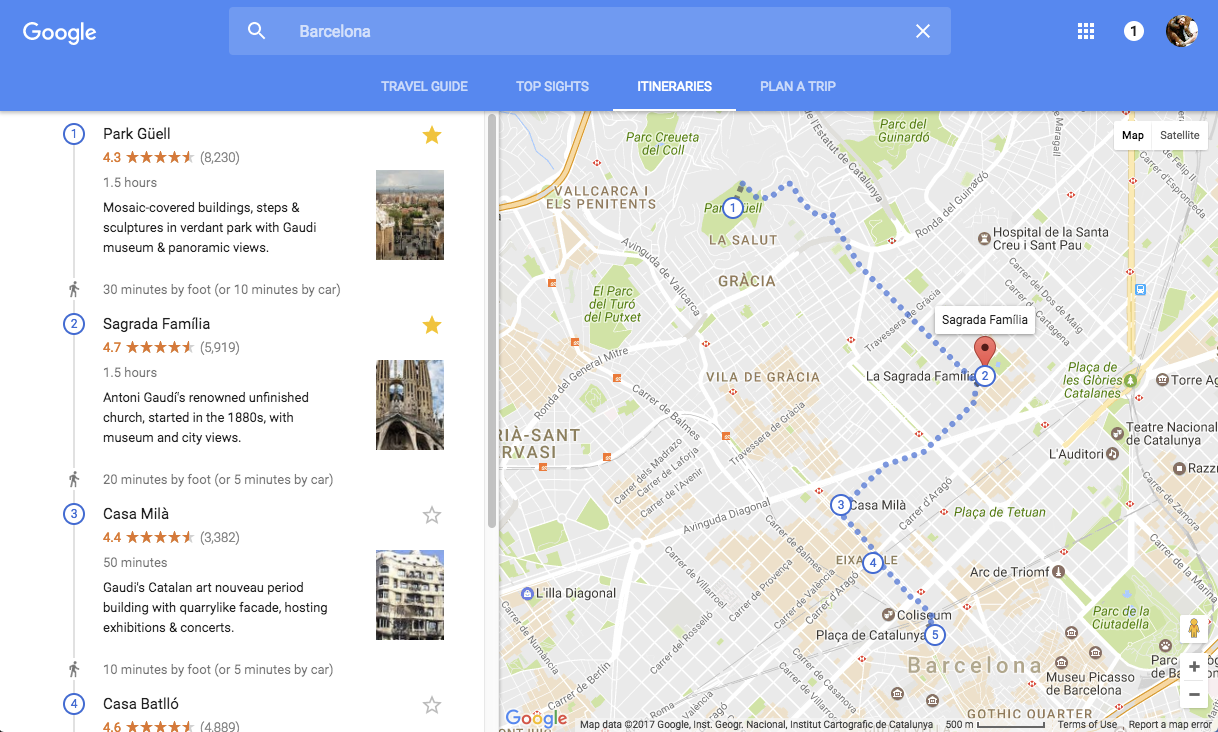
The second map is a little more complicated. It shows itineraries for destinations,
including routing between a set of sights. The amazing thing is that many of these
itineraries are generated automatically from real data of where and what things people
actually visit when they are traveling.
 (or open it in a new window and interact with it).
The user can pick from a number of itineraries, depending on their interests.
In addition, the above image is an itinerary that was custom built (just for me)
to include sights that I had starred as favorites. This is a powerful feature.
(or open it in a new window and interact with it).
The user can pick from a number of itineraries, depending on their interests.
In addition, the above image is an itinerary that was custom built (just for me)
to include sights that I had starred as favorites. This is a powerful feature.
Artifacts
At the end of 2016, my wife and I took an extended trip to Spain and Portugal (with a few side trips to Morocco, Paris, and Oslo). We purposely used only online tools to plan our trip, including our new tools from Google. I wrote a trip report on what worked and what didn't, along with a list of suggested improvements to our tools.
Academic
Education
Graduate School
I hold a Ph.D. in computer science from the University of North Carolina at Chapel Hill (emphasis on computer languages, distributed programming, and computer graphics; 4.0 GPA). I was able to waive almost all of the required courses by taking the final exam for each class. That allowed more time for research. I was a research and teaching assistant for Fred Brooks, who among many achievements wrote an influential book "The Mythical Man Month". Brooks was also on my dissertation committee.
I designed a high-speed dataflow graphics processor and built a simulation for it. The simulation was written using "C with Classes", which had been created by Bjarne Stroustrup to do discrete event simulations. He was happy to have me use it and give feedback because it was still under development. C with Classes was initially a preprocessor for C, but it evolved into C++ while I was using it. I became the first person outside of Bell Labs to use C++, and when C++ was released they featured a dozen projects that had been built with it and mine was the only one from outside Bell Labs.
I was also a research assistant for Henry Fuchs, who was heavily involved in the national SIGGRAPH (computer graphics) conference, which was (by far) the largest conference put on by the ACM. I had already had a paper on human vision and anti-aliasing accepted to that conference (see the section on Texas Instruments). It was the first paper that took the human visual system into account in order to better remove visible digital artifacts (like jagged lines and pixelation) from computer-generated imagery.
I wrote the software used to keep track of conference submissions and reviews for SIGGRAPH, by converting their old, massive, and opaque computer program (the printed listing was over an inch thick) into a half-dozen one-page shell scripts that called various Unix utilities (awk, sed, sort, tbl, grep, troff, etc.), which ran faster and provided far more functionality. I was volunteer staff and a reviewer for the conference for many years, and the contacts I made there come in very handy later. Fuchs was also involved in the DARPA VLSI Project, and I was able to design (and get built) one of the first VLSI chips from a university. It was called "Ghostwriter" and was called out as an example by the project as an early success.
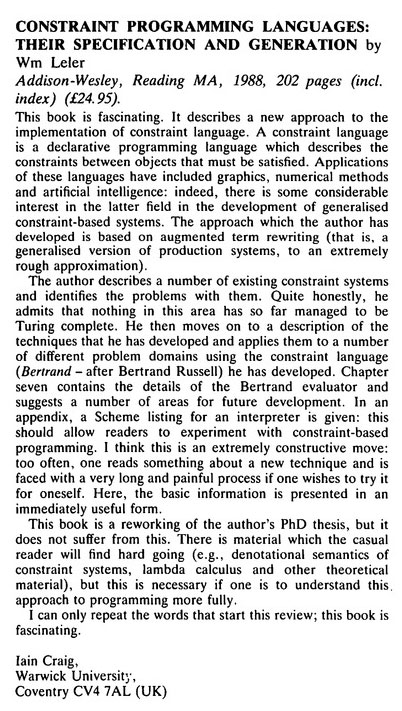
My dissertation was on a declarative computer language I created called Bertrand that can generate Turing-complete constraint solving systems. The Tektronix Computer Research Lab was interested in constraint systems for use in Computer Aided Design (CAD) so they hired me and had me continue my thesis research there. When my dissertation was finished and accepted, I started getting many requests for copies of it. I expanded it into a book, and two publishing firms got into a bidding war. The book became quite popular (see one review at right) and that led to my first invited papers at various conferences, including some international ones. A few years ago I started getting requests for the code, so I put it on github.
I also attended a class on dataflow computing at MIT.
Undergraduate Degrees
I received dual degrees at Rice University: a B.A. in Electrical Engineering, with an emphasis on computer hardware and social modeling, and a B.A. in Fine Arts, with an emphasis on computer graphics, film making, and photography. Engineering reserach was on social modelling, based on "Limits to Growth". As part of my Fine Arts degree, I built both hardware and software to create the world's first computer-generated hologram. I also did a weekly music show on the campus radio station, and also did news.
While I was a student at Rice, I was one of the people behind "Election Central", a local consortium that supplied election results to television stations and newspapers. I designed and built hardware and software to relay election results in real time to the television stations. This was my first big experience with heterogeneous distributed computing over an unreliable network, and where reliability was paramount.
At the time, the only digital display that TV stations had was a character generator (commonly called a "Chyron") that was used to display sports scores and weather, however, an operator had to type in the text in advance. I built a hardware interface so that an Apple II computer could pretend to be a keyboard and "type" election results directly into the character generator in real time. The same computer also connected to a remote mainframe to download the election results. In order to get the required speed, I wrote all the software in 6502 assembly language (including the user interface). The resulting system was mentioned on national TV because we were displaying election results faster than the networks. During one election it was the only system displaying results for a while because the national system had crashed.
Teaching
When I graduated from Rice University they asked me to teach a course on computer graphics. Later, when I worked at Tektronix in the Computer Research Lab, I taught several graduate-level courses (on computer graphics and parallel computing) at the Oregon Graduate Institute (now part of OHSU). I also started and ran a popular speaker series on computers and the arts, and received funding from the Oregon Center for Advanced Technology Education to bring nationally known speakers to give talks on computer graphics, computer music, and other topics.
After Tektronix, I spent a year as a visiting researcher doing work on parallel computation at the University of Manchester in England. I supervised a few students and one of those students would later move to the US and help me found two companies. Years later, I was also visiting faculty at the Victoria University in Wellington, New Zealand.
Back in the US, an English company called The Instruction Set was expanding into the US, and asked me to write and teach some courses for them. These were industrial courses, typically all day long for three to five days. I wrote and taught courses on C++ and object-oriented programming for them.
I also wrote a course for Instantiations (a company that was later partly acquired by Google). This was an unusual course for me. It was written for Mentor Graphics, the leading company in EECAD design software. Mentor was severely behind schedule on their new, completely object-oriented EECAD system, but they needed a course written for their upcoming release. The engineers were so busy that I couldn't talk to them or even ask them questions. I had to make up everything about why the system worked the way it did and the right way to use it, which was difficult because the system was quite complicated and unlike any other EECAD system before it.
I finally met the engineers just before the release, when I previewed the course for several dozen of them so they could give me feedback before I taught it. They loved it. In fact several of them came up to me afterwards and said things on the order of, "Ah, so that's why we built the system the way we did!"
There is a partial listing of other publications at ResearchGate.
Finally, I have had a long relationship (including as faculty) with the Banff Centre, a prestegious art school in the Canadian Rockies. See the separate section on that.
One of my strengths is that I am good at explaining even complex systems in ways that can be easily understood, both by technical and non-technical people. I build a mental model of how a system works, so I can explain it in a way that is consistent and visualizable. I do this because I myself need such a model in order to understand and effectively use a new system.
Vanadium Project
The Vanadium project (originally called "Veyron") was my first job at Google. Its goal was to make it easier to build large distributed applications that were secure and robust (e.g., could deal with unreliable networks). I was hired to figure out how to build distributed user interfaces for applications that might be spread out over dozens of heterogeneous processors. I started working on a design document, but in talking to people I noticed that different people had different definitions of the goals of the whole (Vanadium) project. So I came up with my own definition and wrote it into the introduction of the document. When I sent the initial document out for comments, one of the seniormembers of the team told me that it was the best definition of the Vanadium project he had seen.
Firebase
One of the test apps they were working on for Vanadium was called the "boxes" app. People on various devices would be able to draw rectangles on their screen, and the boxes would appear on the screen of every connected user. Even if devices become disconnected from each other the app should continue to work, and handle when they reconnect.
Because I had experience writing distributed apps, they asked me to write a version of the test app that did not use Vanadium, for comparison. They were expecting me to take at least a few weeks to build this, so they were surprised when I got my version working in a couple of days. I used Firebase to build the app because it had synchronization built-in, plus it had some security features (this was before Firebase was acquired by Google). Here's the app: This is not a screenshot -- you can actually play with this app (you can also open it in a new window). There is security, so you have to log in. You can log in anonymously, or (better) use your Google credentials, or create a new userid and password. Once logged in, you can choose a color, draw, move, or delete boxes, and pan the view surface.
The button in the upper right corner with a number on it tells you how many devices are connected to the app. If you press this button, it disconnects your device from the app (simulating a loss of connectivity). You can continue to draw, move, or delete boxes, and when you reconnect (push the button again) the app synchronizes with the other devices.
I added the disconnect feature for a reason. At the time, the Vanadium team was convinced that they could automatically resynchronize any distributed app, but my experience was that the semantics of resynchronizing an app was dependent on the app. Instead of building resynchronization into Vanadium, it was important to give the developer a set of helpers for common types of resynchronization, and also allow them to define new ones.
I scheduled a tech talk and told everyone to bring a device (phone, tablet, notebook, etc.). I gave a short presentation, then had everyone (around 40 people) connect to the app and play around with it for a while. I projected my copy of the app, so they could watch it synchronize with everyone. Then I had everyone disconnect their app, and continue to play with it. After a few minutes we had a big countdown and everyone reconnected at (nearly) the same time. Then they watched what happened.
I had built this app with a very simple resynchronization semantics -- changes were merged in the order they arrived at the Firebase server. Because this was essentially random, the merge was not deterministic. If (while disconnected) one person moved a box while another person deleted the same box, after reconnecting the person who moved the box might see it disappear. Alternatively, the person who deleted the box might see it reappear in a different location.
Even with such simple synchronization, there were still semantics that were dependent on the app. For example, if a box had already been deleted by one person, a move by someone else was discarded, so that boxes would not magically reappear. This started a big discussion of the right way to do synchronization, which had been my goal.
One thing that surprised them was how fast Firebase was at synchronization. Even with 40 devices, when one person moved a box everyone saw it move smoothly to its new location in near realtime. Even when everyone was moving boxes at the same time, things stayed synchronized. In their Vanadium version of the app, they only synchronized when the user stopped moving a box, so everyone else would just see the box jump to the new location.
This was my first techtalk at Google, and people told me they really enjoyed it. It also started some good discussions and even a few changes to Vanadium.
Namespace Browser
The main project I worked on was the Namespace Browser. I joined two other engineers who had begun the project before I started at Google. I really enjoyed this project, mainly because I got to learn some exciting new things and work with two really good engineers.
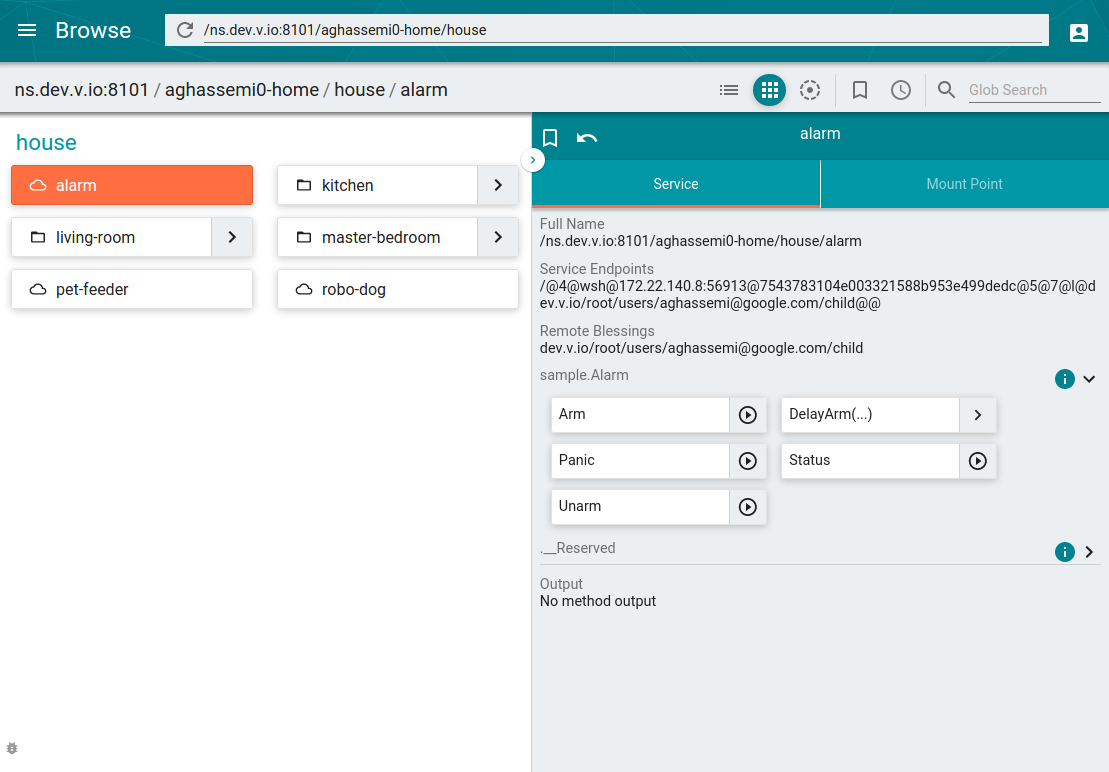
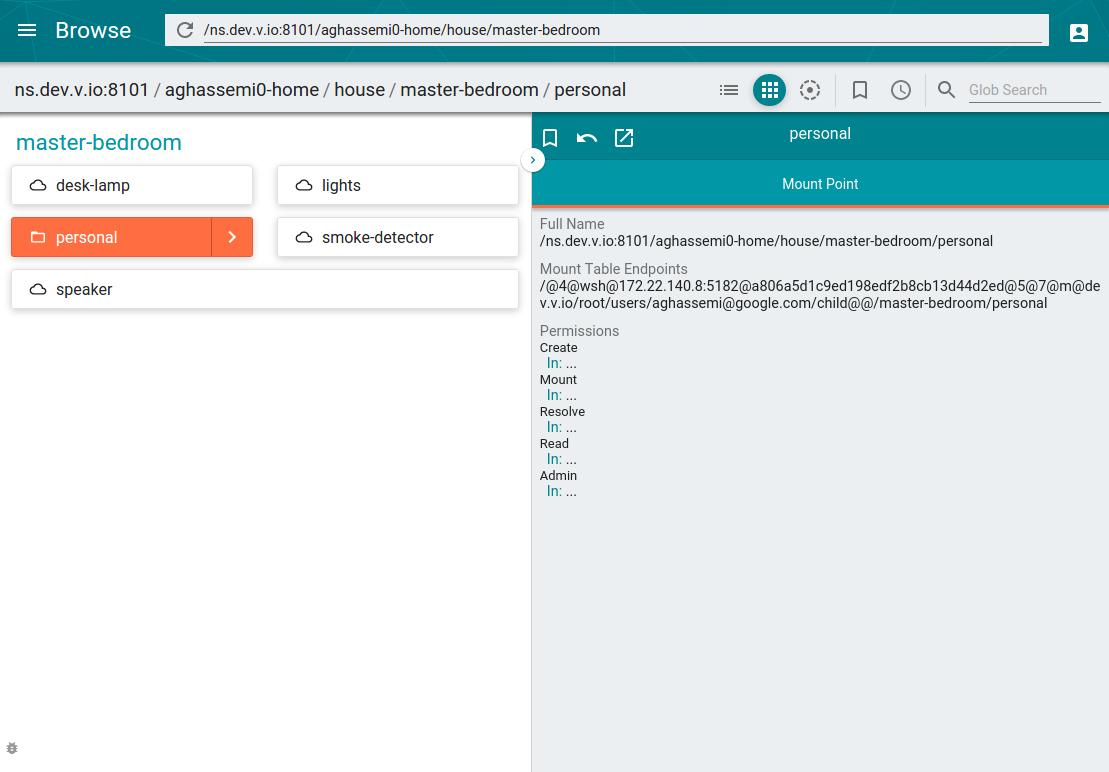
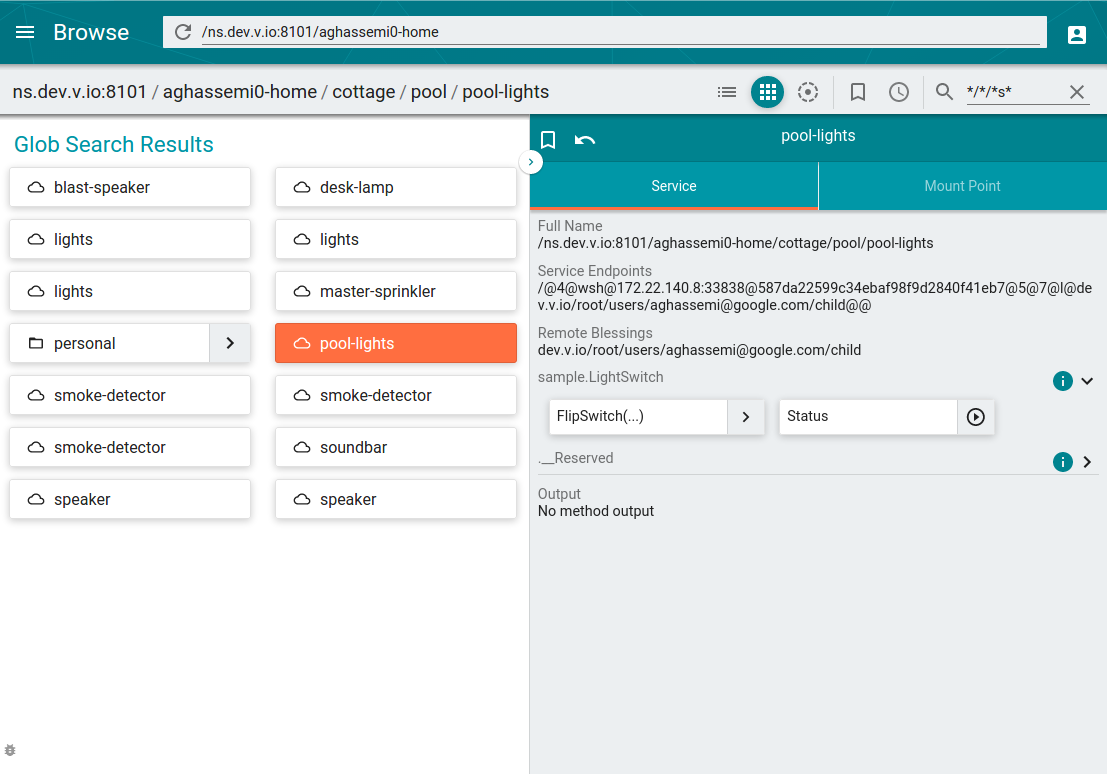
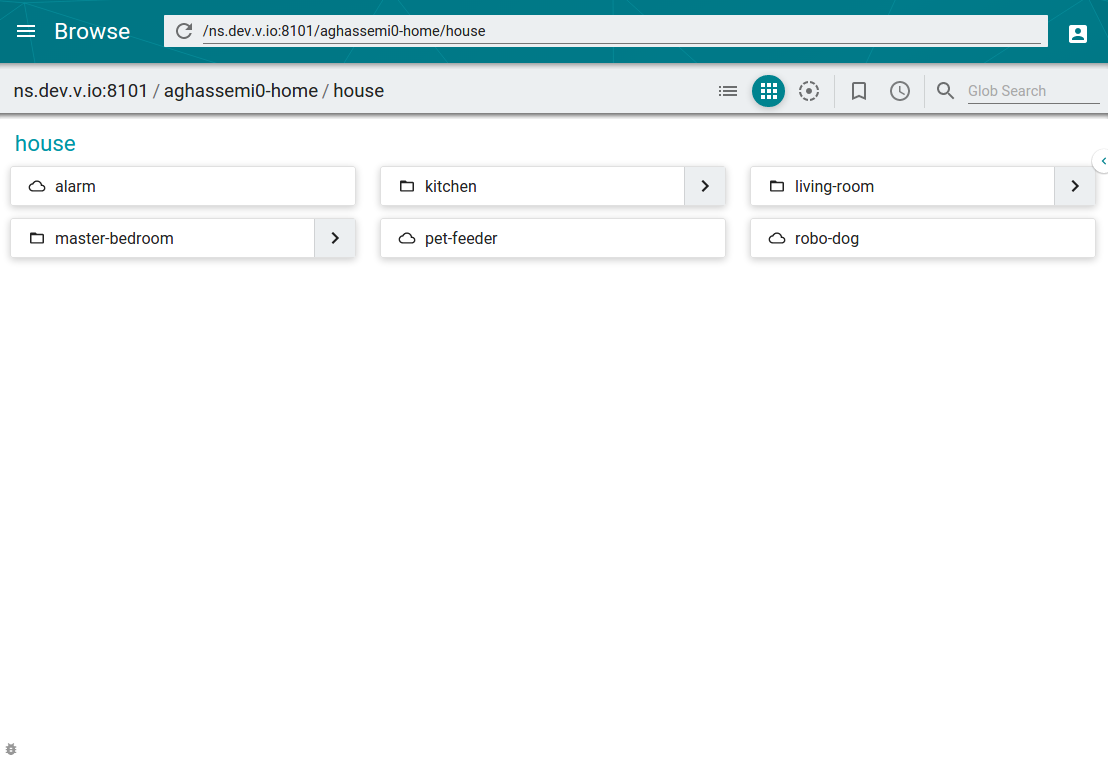
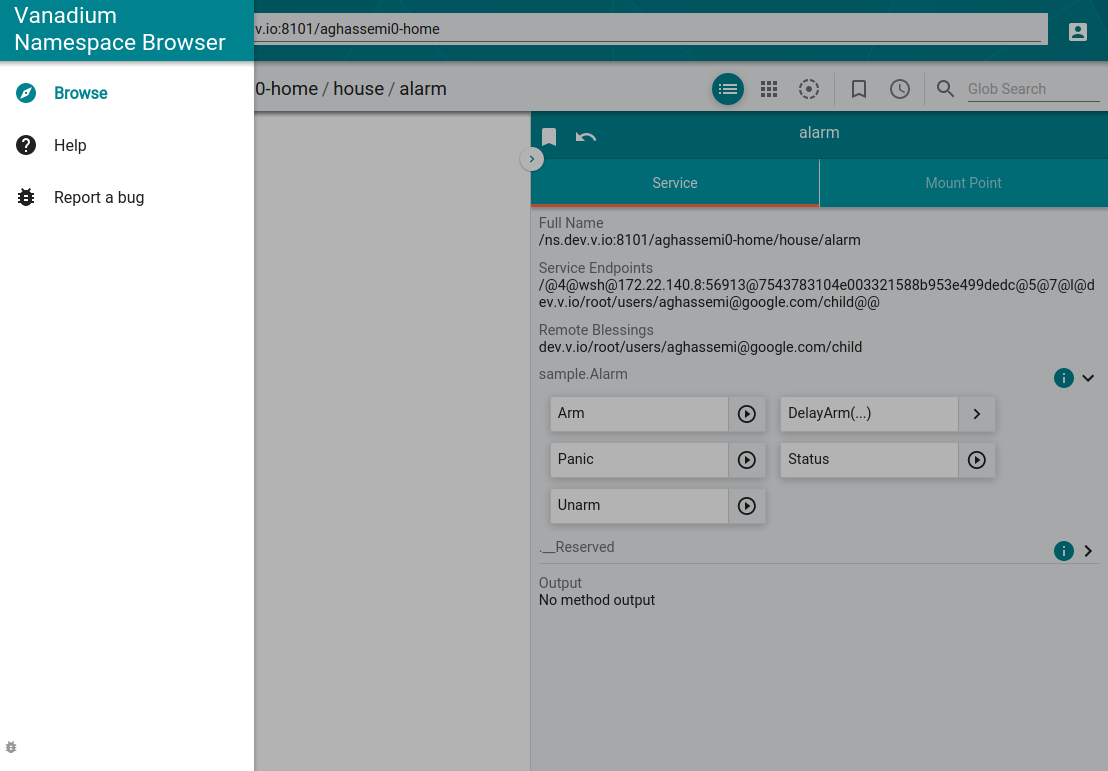
A Namespace was a Vanadium concept that provided distributed naming services to Vanadium apps (analogous to how DNS supplies a hierarchical name service to the internet). The original purpose of the Namespace browser was to allow people to explore a connected set of namespaces, but we quickly went far beyond that. In addition to exploring namespaces, the user could discover services provided by devices, and even call methods on those services. This was extremely useful for debugging Vanadium apps. I even created a design that would have allowed people to build a complete app using the namespace browser and built a simple prototype.
The Namespace Browser was built with an FRP (Functional Reactive Programming) framework called Mercury. But the best part for me was the use of Polymer, Google's web component architecture, which was very new (we were using version 0.5). This allowed us to use Material Design widgets to create a really beautiful and functional tool, and do it quickly. (As a side note, this resume also uses Polymer). Unfortunately, now that the Vanadium project is dead, you can no longer run the Namespace Browser, but here are some screenshots:
The first screenshot shows the tree view (in the left pane). For this view I created a Polymer component to display each node in a tree of namespaces. You can expand and collapse a node, and also select a node and see details of its services and methods.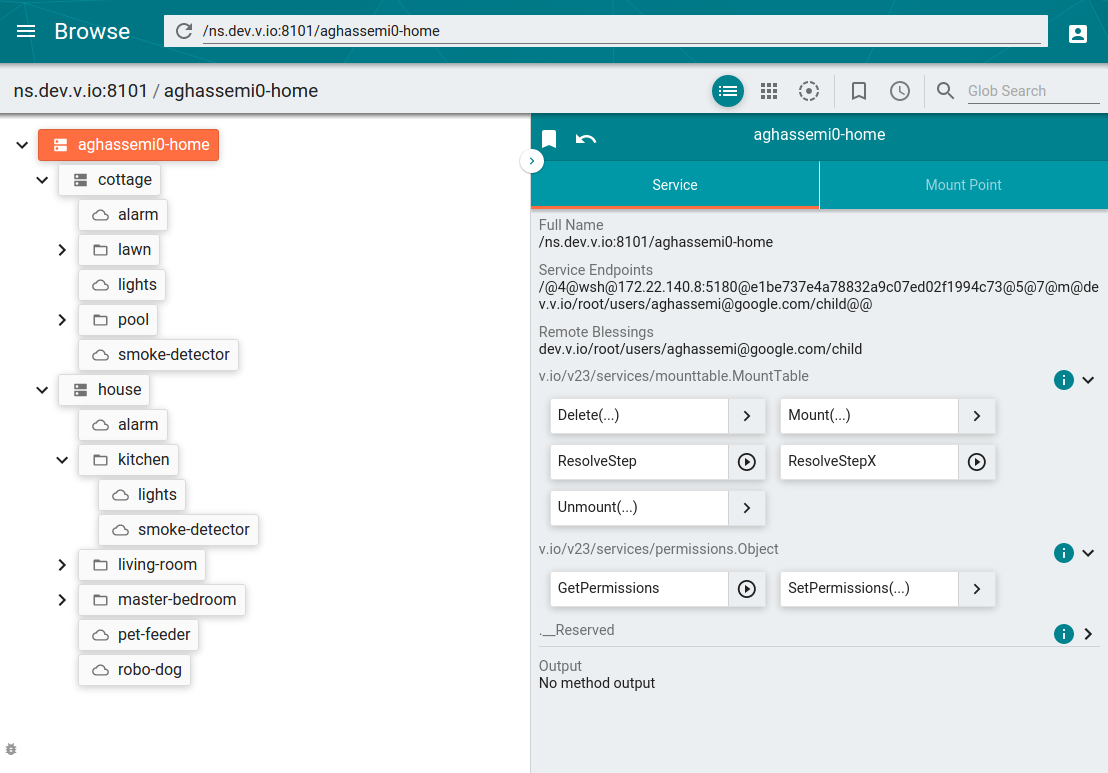
The third screenshot shows what we called the radial view. I built it using D3.js, a really cool data visualization library. I submitted the interactive radial tree widget I created back to the D3 examples library, where it has been used by others and even forked a few times.
Wrote design document "Namespace Browser Use Case" for expanding the Namespace browser to become a full prototyping environment for Vanadium. Started work on this just before Vanadium was cancelled.
Documentation
While working on the Namespace Browser I also got involved in writing and editing documentation to get the Vanadium project ready for release. I wrote tutorials, but my bigger task was as "editor in chief": reviewing the documentation being written by various people and making sure it was clear and well written, and used terms consistently. As part of this latter task I created a glossary and got everyone to agree on terms (which was a big task).
I did this despite the fact that I was told that (as an engineer) working on documentation was a waste of my time and would hurt my career. But I couldn't imagine the project succeeding unless we made it easy for outside developers to learn and use the system.
Artifacts
- Papers: "Thoughts on Vanadium, UI and UX", "Namespace Browser Use Case"
- Firebase boxes application
- D3 interactive radial tree widget
- Repository
- Online Documentation
Zat, Inc.
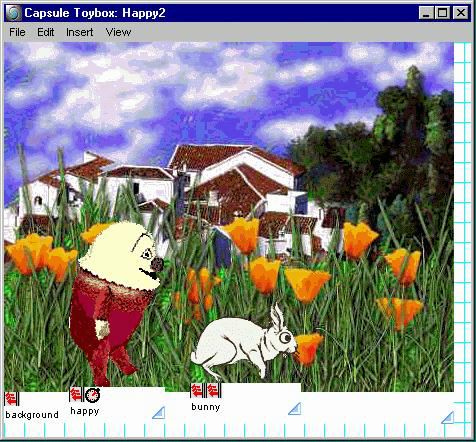
The first company I founded myself was Zat, Inc., which built a component assembly tool for Java.
Our target market was interactive multimedia authoring.
We were going up against an entrenched authoring tool (Macromedia Director) so we knew it was
vital to win over developers to our new product.
 I started by putting together an outstanding advisory board, including:
- Andries van Dam: author of the standard textbook for computer graphics, the founder of ACM SIGGRAPH, and chair of the CS department at Brown University,
- Adele Goldberg: the mother of Smalltalk at Xerox PARC, who had gone on to found a company building interactive educational software,
- Josh Portway, who worked for rock musician Peter Gabriel at Real World Studios, a major multimedia producer,
- Alan Kaiser, one of the creators of Myst, one of the most popular multimedia games at the time,
- Hamish Forsythe, who founded mFactory, the creators of mTropolis (another popular multimedia authoring tool), who had sold his company.
As soon as we had an early version of the product we seeded it to a number of developers. To do this I created a website for the developers, including sample programs, tutorials, and other content (archived at http://appcomposer.com/Zat2/). I also ran a mailing list for the developers and did all the other things that would fall under the role of a "developer advocate". Because our tool was based on reusable components, we also created a site for developers to share (or even sell) their components.
 The feedback we got from our developers turned out to be crucial.
One of the things developers liked most about our alpha product was that
(because it was based on Java) it could be used to build web applications,
which were just getting started at the time.
There was no other product in that market, so we would not have to compete
with an established large player.
We quickly reinvented our product as a tool for building web applications using reusable components.
We added the ability to use Enterprise JavaBeans as components, and started another
partnership with Pointbase,
a database company that was creating a new object-relational database for web applications.
The feedback we got from our developers turned out to be crucial.
One of the things developers liked most about our alpha product was that
(because it was based on Java) it could be used to build web applications,
which were just getting started at the time.
There was no other product in that market, so we would not have to compete
with an established large player.
We quickly reinvented our product as a tool for building web applications using reusable components.
We added the ability to use Enterprise JavaBeans as components, and started another
partnership with Pointbase,
a database company that was creating a new object-relational database for web applications.
However, having a product with no competition is both good and bad. For example, developers have no idea what you are selling (you can't say "we're like Director, but with these advantages"). We needed to find and reach out to these new developers. I went on a press tour of the magazines (and new web magazines) that were covering the new world of web apps and got articles published about our product. I also created a course on application assembly, which I taught at the JavaOne conference. The word was getting out and the number of developers was starting to take off. There was enough interest that we started selling our beta product! One thing that surprised even us was at the Web '99 conference, we were awarded the "Programming tool of the year" award (even though we had not released our product yet). I also collected testimonials from our developers, including a few big names in web app development. One company built an entire ecommerce solution using it and used it for a DVD rental website. Ironically, our tool was also used to create computer graphics for a major Hollywood motion picture. I also did outreach to educational institutions — a professor at a university was even using our tool to teach Java programming.
There was lots more of course, but the happy ending was that our startup was acquired (even before we released our product). Not too bad for a company with only seven people.
Texas Instruments
Seismic Interpretation
My first job out of college (before grad school) was working for Texas Instruments in the Geophysical Services Division, which developed products for oil exploration. TI hired me to solve a big problem regarding the display of seismic data.
Oil exploration is done by laying down a long string of special microphones, called geophones, then setting off explosions to generate underground shock waves and recording the reflected signals captured by the geophones. In the past, these signals were plotted in real time using pen plotters, similar to the lie-detecting polygraph machines you see in movies. When all the signals are plotted, it looks like this:
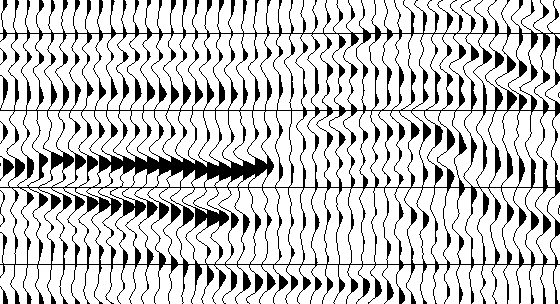
Note that the peaks of each signal are filled with black, to make it easier to see a row of high amplitudes; such a row is called an "event". This kind of plot is called a "wiggle trace" and geophysicists are able to look at these plots and decide where oil might be hiding. But this technology had reached its limit. Strings with over a thousand geophones were common and TI was already making pen plotters the size of rooms, (which required humongous sheets of paper), and then mounting them carefully in giant trucks so they could drive them out to where the oil surveys were being done.
But an even bigger problem was on the horizon. Oil companies were starting to do three-dimensional surveys where they would collect data from a string of geophones and then move the string over a few feet and do it again, repeating over and over to collect data for a big 3D cube of earth. It was impossible visualize this much data using a plotter and paper. Something more dynamic and interactive was required.
The oil industry knew that dynamic computer graphics was the answer, but they had run into a roadblock. Geophysicists insisted on seeing wiggle traces, but displays were still fairly low resolution. There was no way to diplay that many wiggle traces on a computer monitor. The only way to show that much data on a monitor was to display the value of the geophone signal as a pixel of color. In the industry, this was called a "variable density" display, but geophysicists refused to accept a variable density display.
As a result, companies (including TI) were spending millions of dollars trying to develop and manufacture incredibly high resolution displays. Imagine how much resolution would be required to display a thousand wiggle traces, and then imagine how huge that display would have to be so someone could actually see each trace. I was hired to figure out a better solution to this problem.
I needed to figure out what was going on, so TI arranged for me to visit some geophysicists while they were working and ask them questions. I quickly noticed something interesting. Every geophysicist had a small metal ruler in their shirt pocket and they would frequently use these rulers to measure the size of individual wiggles to determine the amplitude. They would then compare amplitudes between events.
So we built a graphics display that used variable density, but we added something new. We implemented two cursors that the geophysicist could move using an input device (at the time, a military style joystick). The computer would display the amplitude of the signal under each cursor to a much finer precision than they could get with their rulers, and would even compare amplitudes so they could plot correlations between events. The geophysicists loved it, and the oil industry switched over to this kind of display quickly.
I learned two things from this. First, that geophysicists were so used to plots on paper, it never occured to them (nor to the companies making equipment for them) that there was a completely different way to solve the problem (years later, people would call things like this a "paradigm shift"). Second, and more importantly, I discovered that you can never just ask customers what they want. They often don't know, or even if they claim to know, they are often wrong. Instead, you have to understand the underlying problem they are facing, and solve that.
Anti-aliasing
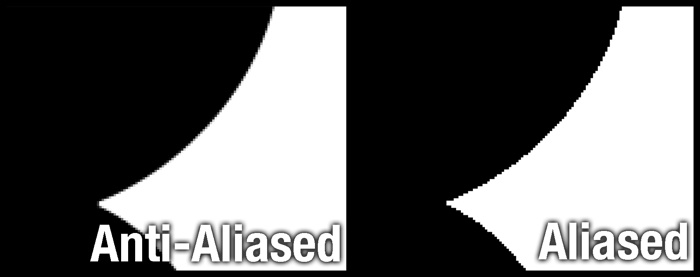
Another problem I worked on at TI was aliasing. Computer monitors have limited resolution and when you are displaying huge plots of data, lines look jagged instead of smooth and areas of color become pixelated (like an old-style video game). This is not a problem just for seismic data (and old video games), it affects CT and MRI scans of the human body, radar displays, and computer animation. Aliasing artifacts can often overwhelm the underlying data, making it much harder to see pockets of oil, or tumors in a human. Computer graphics researchers were already searching for a solution to this problem.
I had done earlier research on human vision, so I started working on this from a human physiology perspective, rather than a mathematical perspective (which is what most graphics researchers were doing). Why was the eye attracted so strongly to aliasing artifacts and how can an image be modified to reduce the effects of aliasing? I started digging deeply into research in human vision and it turned out that during WWII, when radar was a new and critical technology, there was a ton of research done on this in many different places. I spent weeks requesting books and papers from all over (remember, this was before the internet; I'm still friends with the TI librarian).
What I found was surprising. Using the right techniques, you could not only significantly reduce aliasing artifacts, you could make a computer display appear to be much higher resolution than it is. This was of big interest not just to the oil industry, but to almost all areas of computer graphics.
I wrote a paper titled "Human Vision, Anti-aliasing, and the Cheap 4000 Line Display" and sent it to the national SIGGRAPH conference. When I presented it at the conference there was a lot of discussion because my solution didn't require the complex mathematical functions found in other solutions. Another paper in the same session with me even contradicted my results. I think most people there didn't believe me at first, but within a few years the industry had come around. Indeed, more than a decade later I was visiting a friend at a university and we ran into a professor who was teaching the graphics class. When he heard my name, he told me that his class had just read my paper the week before.
What I learned from this is that humans (not just their vision) are poorly defined by common mathematical functions, and don't always act as expected. As another example, for a while software companies tried to solve security problems by forcing people to use longer and more complex passwords and even force them to change their passwords frequently. That may have made it harder for passwords to be cracked by brute force computer methods, but it didn't solve the problem of social engineering (where a thief fools a person into giving away their password). In fact, in some ways it made the problem worse. Computer applications must take human behavior into account.
Banff Centre for the Arts
Artist Colony
At a computer graphics conference, I met a professor from the Banff Centre (a prestegious art school in the Canadian Rockies). He invited me to come visit him there, which I did. I had an art degree but it mostly took a backseat to my computer work, so this was my big chance to do some art!
The Banff Centre was building an artist colony and they invited me to come spend seven weeks there the first summer it opened. There I met major artists from around the world, but I was something of a curiosity in the colony as I was the only person using computers to create art. But by the end of my residency I was invited to come back as staff at the Centre to help artists create more art with computers.
Virtual Reality
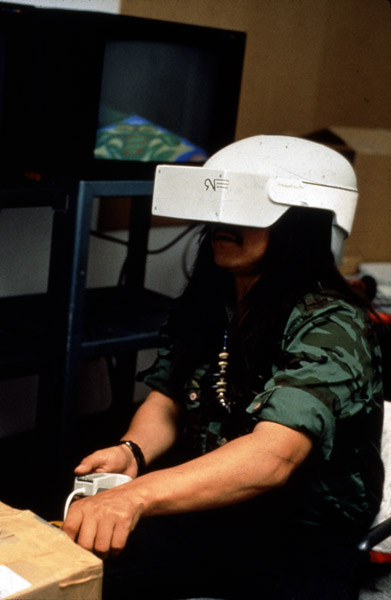
The Banff Centre was starting a major program on Virtual Reality. I helped write proposals and get funding to build that program, including getting major donations of computer equipment from Silicon Graphics, Microsoft, and others. While this was happening, we did a summer residency and brought artists in to build artistic virtual environments. These artists were not computer literate, so we worked with them to build some of the earliest virtual worlds. One of these worlds ended up going on tour to art museums around the world. It was an exciting time. I also got some papers published on building virtual worlds, and delivered talks at conferences.
Artistic Web Applications
Five years later, I came back to the Banff Centre as faculty for a program about artistic uses of this new thing called the World Wide Web. This was a fantastic program, which brought together major artists and technologists, including people from Apple, Microsoft, RealWorld Studios, Interval Research, and many others including filmmakers, authors, and game developers. I helped design and build the first web-based game. I also helped them put on a conference about the Web aimed at artists.
This was my longest stay at the Banff Centre (9 months). The people I met there eventually led to me starting my first company, Zat Inc.
Location-based Mobile Apps
Another five years later, I came back as faculty to help teach a month-long course on location-based mobile applications. The Banff Centre had received a donation from HP of some early PDAs that had GPS hardware and software and wanted to build some art projects using them.
During that time, I was named a Banff Centre Fellow for my contributions over the years.
Conferences
In addition to working at the Banff Centre from time to time I also helped put on various conferences at the Centre. My favorite was a conference called "Digital Burgess" put on by a group called Biota.org, of which I was a member.
Biota.org was an international organization of people working on artificial life simulated on computers. The Banff Centre is close to the Burgess Shale, a World Heritage fossil site that inspired the book "Wonderful Life" by Stephen Jay Gould. For the conference, we not only had computer researchers working on artificial life, we also invited scientists working on biological life (paleontologists, biologists, ecologists, anthropologists, and others). These two groups of people had never met and the conference was amazing and led to some interesting collaborations.
Ithaca Software
At one of the SIGGRAPH conferences I was contacted by the founders of Ithaca Software, Carl Bass and Garry Wiegand, a startup that made a good 3D graphics library called HOOPS. They were familiar with my graphics work and they wanted to talk to me. The issue was that even though their product was successful they knew that they had to come up with new products to take their company to the next level. They hired me to be in charge of new product development.
GAF & Thangs
I was invited to join a group of companies and academics that were trying to come up with a new standard for object-oriented 3D graphics. The group was called GAF (Graphics Application Framework), and was led by Andy van Dam, who I knew from SIGGRAPH (he founded that conference, and also written the standard textbook on 3D graphics). Members included Sun, Microsoft, and others. Ithaca Software's interest was in implementing this new standard and productizing it.
It turns out that object-oriented (OO) programming has its limitations and people in the group had problems designing a good OO framework for 3D graphics, even though OO frameworks are popular for 2D graphics (e.g., Smalltalk, Apple's Cocoa, and others). Without going into a big discussion of the problems, what I came up with was a framework that was more based on components than objects. The framework was called "Thangs", and had the added advantage that it would help people build 3D graphics software that ran on parallel computers.
Garry Wiegand and I started implementing Thangs, and even had a small working protype framework. I also delivered a paper on Thangs at a graphics conference in Europe. But this work came to an end when Autodesk suddenly decided to acquire Ithaca Software. Autodesk was mainly interested in acquiring our graphics expertise for their products, and wanted to shut down new product development.
3D with HOOPS
Ithaca Software did manage to talk Autodesk into releasing HOOPS as free software,
so current customers would not be left in the lurch.
As part of this, Autodesk asked me to write a book about HOOPS.
I agreed.
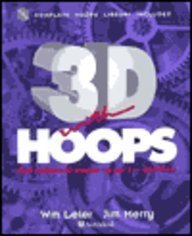
As was common at the time, the book included a CD with a free copy of HOOPS along with the code for all the example applications.
Not long after that, I was visiting a friend in New York City, and she dragged me to the NYU bookstore. The book was featured in the front window of the store. HOOPS is still popular, and is one of the longest-lived APIs for 3D graphics.
Incidentally, the logo for this section comes from the fact that Ithaca Software was originally named "Flying Moose Software". Also, the name HOOPS originally stood for "Hierarchical Object-Oriented Picture System" (it was somewhat of a backronym because Carl Bass was an avid basketball player). However, HOOPS wasn't actually object-oriented, due to the same problems that GAF ran into. Carl Bass eventually became the CEO of Autodesk, a job he holds to this day.
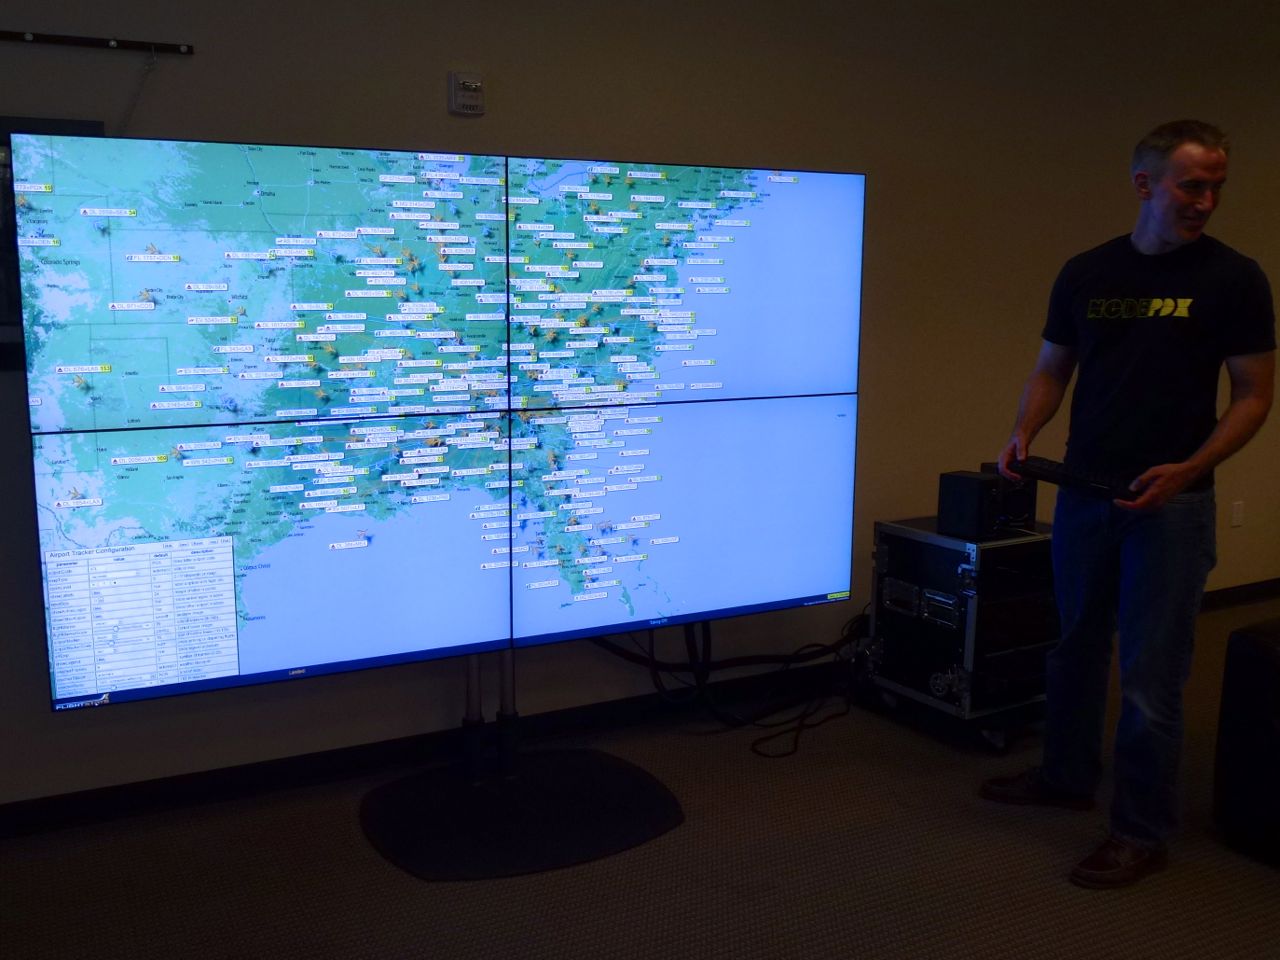
Flightstats
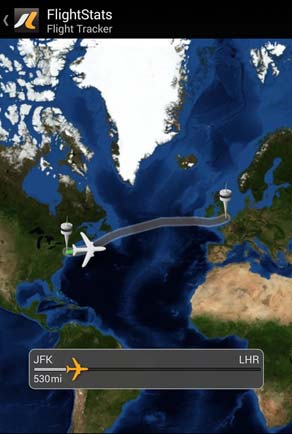
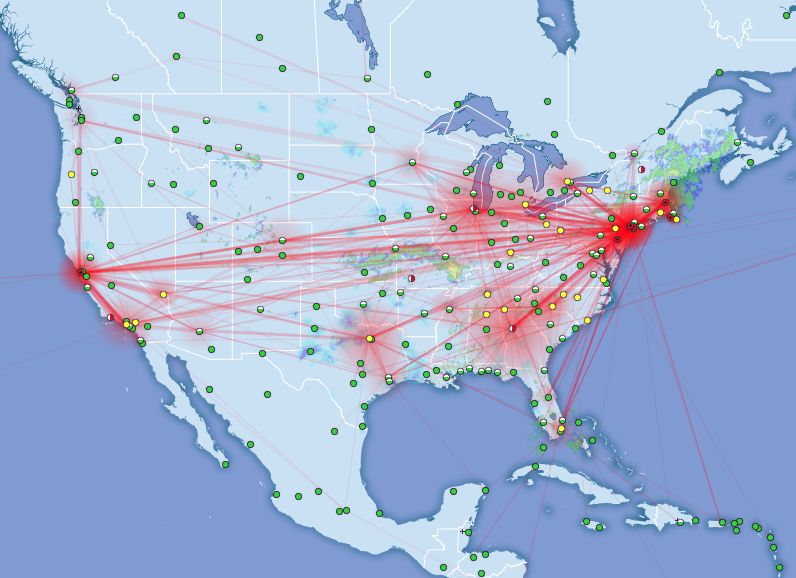
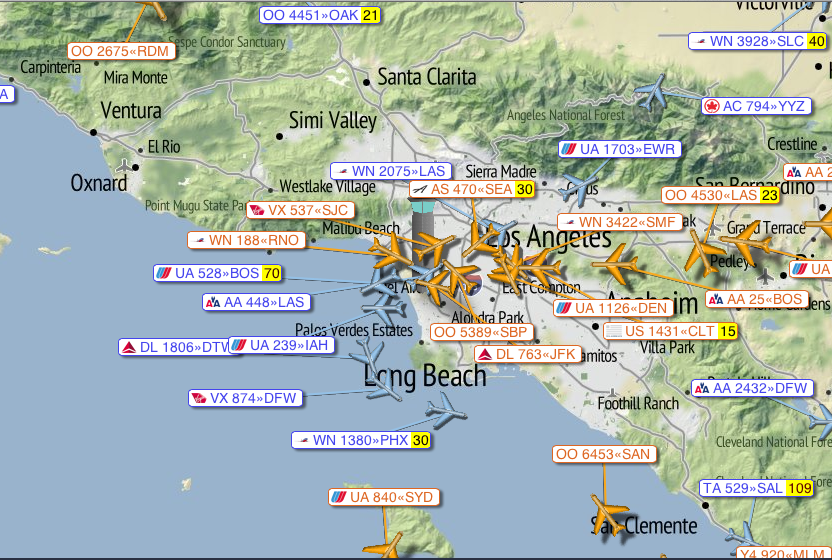
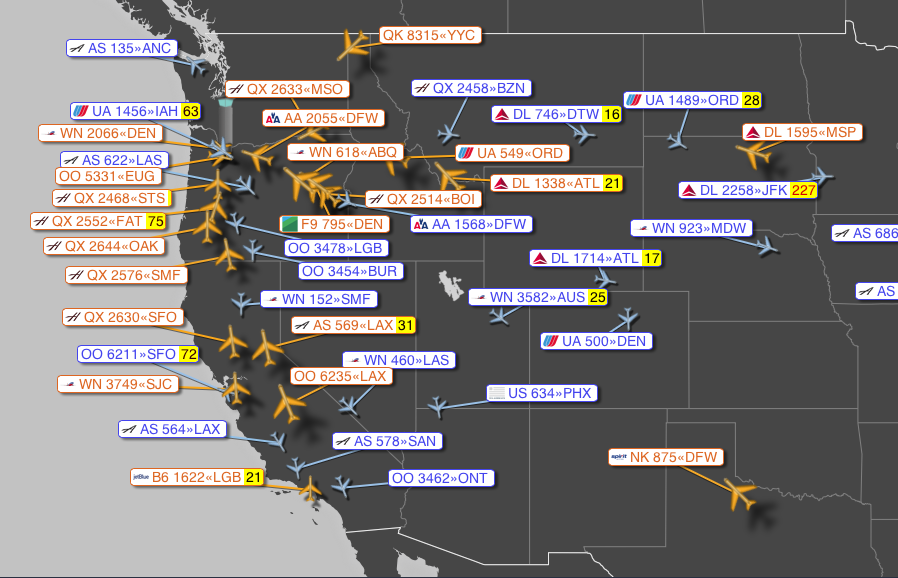
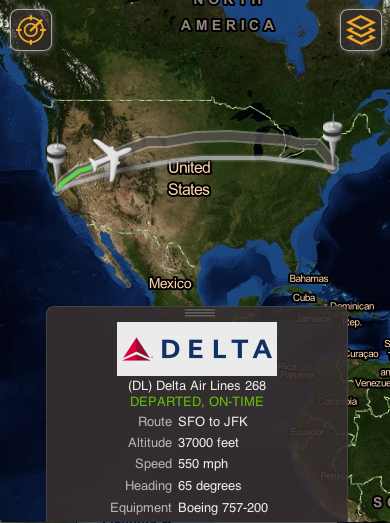
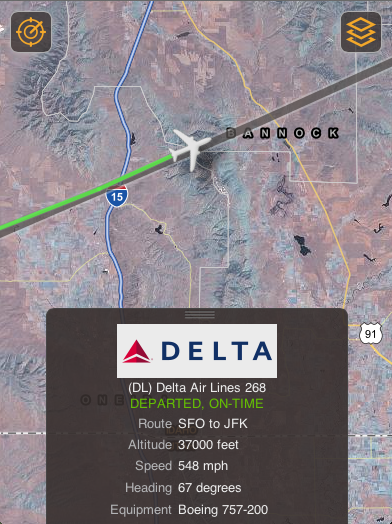
The last job I had before Google was at Flightstats, a supplier of flight status information (coincidentally, Google is one of their customers). I did two major projects for them, in addition to building the map for their Android and iOS mobile apps (at right).
Open Source Maps
First, Google had announced that they would start charging for users of their maps. Flightstats only used Google's maps at a gross scale (like the image at right, from one of the maps I built for them for their mobile apps), so they didn't want to pay if they didn't have to. Partly because of Google's announcement to charge, new open-source mapping libraries were popping up so I did an evaluation of several of them (along with some other commercial offerings). I settled on the Leaflet library, which was free, powerful, extensible, and easy to use.
The next step was to create the needed maps, a job that was simplified by not needing much street-level detail. I found a few sets of open map tiles, and also created a few sets using Mapbox.
Many web developers were interested in switching away from Google's maps so I gave a talk at a local mapping conference, which ended up being wildly popular. I was invited to give the same talk at a half dozen other conferences, including the OpenStreetMap State of the Map conference, NACIS (North American Cartographic Information Society), Open Source Bridge, and Webvisions. In addition, a web magazine contacted me and had me rewrite the talk into an article for them.
Developer Portal
Flightstats decided to build a developer portal, to encourage more developers to use their data. I was a member of the team that built this portal, and also wrote much of the developer documentation for it. Link to the developer portal.
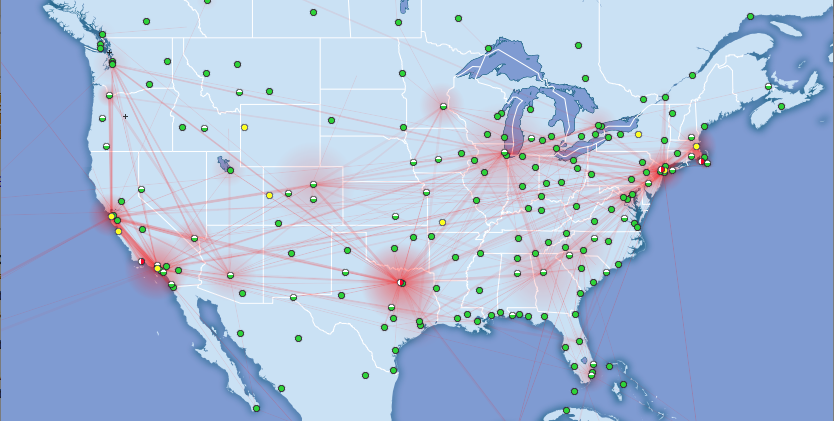
Next, they needed to publicise this developer portal (and their data). I did two things for this. First, I developed several sample applications that used Flightstats data. Second, I wrote a course on how to build a dynamic mapping web app, and started presenting it at conferences. The course integrated Flightstats data, and became quite popular.
When I left Flightstats I told them I was interested in continuing development on some of these sample applications, so they granted me a non-exclusive right to all of them. I also developed a few more web apps and for a while sold them to various airports and airlines for use in digital signage. There are still airports where you can see some of my dynamic maps running.
Here is a product demonstration video I created for these apps:
Here are some screenshots of several of the apps:
Related Hobbies
Open Tech Space
A decade ago I started Open Tech Space, a free center for software and hardware. I raised funding (some of which came from Google), and got donations of equipment (for example, computers, benches, tools, and a high-speed ocilloscope from Tektronix). I partnered with Tech Shop Portland and created a free lab where people could build hardware and software and meet other technical people. We offered regular courses, many of which were taught by members of Dorkbot, such as building your own Arduino, programming it, and building your own printed circuit boards. When Tech Shop Portland closed down, we moved the lab to Portland State University.
Chat
I run a private (invitation only) chat room, which I am told is the longest running web-based chat room on the internet (although how would you know?). I originally started with some software written in Perl, but later rewrote it into a Java Servlet. When I lost access to a public server that would run Java Servlets, I rewrote it into PHP (surprisingly, it ran better in PHP than in Java). Later, I rewrote it as a single-page AJAX application (mainly in JavaScript) to avoid page reloads. When Firebase was released, I was interested so I rewrote the chat room to use it; that way new messages were propagated instantly. I continue to add features over time, like the ability to share files. Because I know the people who use the chat room (I'm one of them) I often use it as a testbed for UI and UX ideas and get feedback from the users.
Blogging
In 2008 I created a blog devoted to politics and humor. I had done other work-related blogs before, but I was curious what it would take to market a new entertainment blog and make it popular. I was inspired by The Daily Show with Jon Stewart, which combined serious politics and humor — why was there no blog that did the same thing? I created it under a pseudonym because it had nothing to do with my normal work. I was not being paid to do this, but it was fun (and educational for me).
I learned how to promote a blog, like sharing links with other sites, posting to aggregators, and so on, and got some good mentions during the run-up to the 2008 election. To my delight, the blog took off — at one point I got a million hits in a day, which cratered my poor little server (I have a server in the cloud now!). After the election I tried to shut it down, but got a big outcry from my readers. Instead, I stopped promoting it and reduced the number of posts dramatically. I still try to post at least once a day. The blog continues to have loyal readers that have created a nice community. I've learned a lot from it.
One thing I learned from my friend Ward Cunningham (who invented the Wiki) was that in order to build a good community you have to respect and trust your readers. Everybody warned me that (especially for a political blog) I would quickly be overrun with jerks flaming and being disruptive (like you see on many sites that allow comments). Despite their warnings, I still allow people to post comments anonymously and without signing in. There have been occasional flames, but the community of readers seems to take care of that. As a result, people who started out by posting flames have often become some of my best readers, and now post good, thoughtful comments.
I think this is something that many companies don't do well. Successful blogging is not just broadcasting, it is about creating a community that cares and defends the blog and keeps it strong and relevant. My readers aren't afraid to tell me what they think, or chastise other readers when they step out of bounds.
Music
I have played several different musical instruments, but I currently play mostly the bass, which I started learning around a decade ago. I mainly play at jam sessions, although I also enjoy performing in public. My wife plays the ukulele so our jam sessions often have lots of ukulele players, but also acoustic guitars, piano, percussion, and sometimes flutes and other instruments. We also attend weekend music events where lots of people get together to learn new things and play.
When I started learning the bass, I found that there was not much information out there for beginning players, so I wrote an introductory bass course just for fun. Word got around and I was asked to teach the course live at a popular ukulele event near Santa Cruz. The class was originally scheduled for a smaller room, but far more people showed up than they expected, so we had to move it to the largest room.
Thanks!
Credits
Design idea credit goes to Ali Ghassemi and the amazing Topeka Quiz application by Google's own Polymer team.
Colors and other patterns by the Material Design guidelines.
Icons and graphics from Material Design Icons, Vanadium UI assets, and respective companies and organizations.
Photo gallery by FOTORAMA
License - MIT
Feel free to use, copy, or modify the code and design of this resume for your own use.
Copyright © 2018 Wm Leler
Permission is hereby granted, free of charge, to any person obtaining a copy of this software and associated documentation files (the "Software"), to deal in the Software without restriction, including without limitation the rights to use, copy, modify, merge, publish, distribute, sublicense, and/or sell copies of the Software, and to permit persons to whom the Software is furnished to do so, subject to the following conditions:
The above copyright notice and this permission notice shall be included in all copies or substantial portions of the Software.
THE SOFTWARE IS PROVIDED "AS IS", WITHOUT WARRANTY OF ANY KIND, EXPRESS OR IMPLIED, INCLUDING BUT NOT LIMITED TO THE WARRANTIES OF MERCHANTABILITY, FITNESS FOR A PARTICULAR PURPOSE AND NONINFRINGEMENT. IN NO EVENT SHALL THE AUTHORS OR COPYRIGHT HOLDERS BE LIABLE FOR ANY CLAIM, DAMAGES OR OTHER LIABILITY, WHETHER IN AN ACTION OF CONTRACT, TORT OR OTHERWISE, ARISING FROM, OUT OF OR IN CONNECTION WITH THE SOFTWARE OR THE USE OR OTHER DEALINGS IN THE SOFTWARE.